Business intelligence (BI) tools are software applications that help organizations collect, analyze, and visualize their data to assist in making informed business decisions. These tools can be used to extract insights from large amounts of data, generate reports and dashboards, and identify trends and patterns that may be difficult to see using traditional methods. BI tools are designed to handle data from a variety of sources, including databases, spreadsheets, and even social media platforms. They typically include data visualization features that allow users to create charts, graphs, and other visual representations of their data, making it easier to spot trends and patterns.
Overall, BI tools can provide significant value to organizations by helping them gain deeper insights into their business operations, identify areas for improvement, and make data-driven decisions that can ultimately lead to increased profitability and competitive advantage. However, companies need to understand these tools and their capabilities to properly employ them. The most popular platforms in the field of BI are Power BI, Qlik, and Tableau. These are all popular tools for creating visualizations and reports, but they differ in terms of their features, capabilities, and ease of use.
When evaluating these options here are some points to consider:
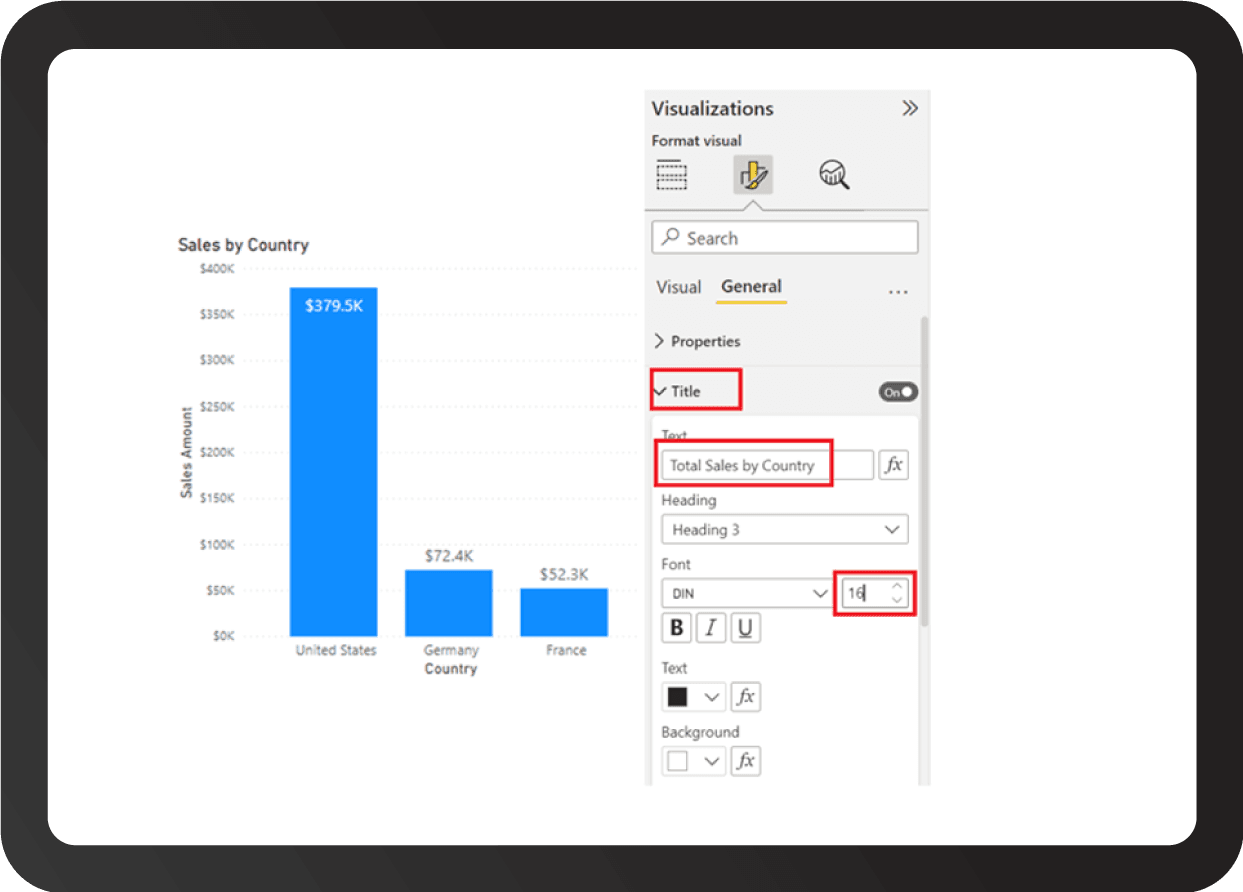
Ease of Use: Power BI is considered the most user-friendly of the three tools, with an intuitive interface and easy-to-learn features. Part of this is a familiarity issue. As a Microsoft product, Power BI has a look and feel that users of the Office suite of tools will find familiar. For instance, changing the fonts and labels feels much the same as in Word or Excel.
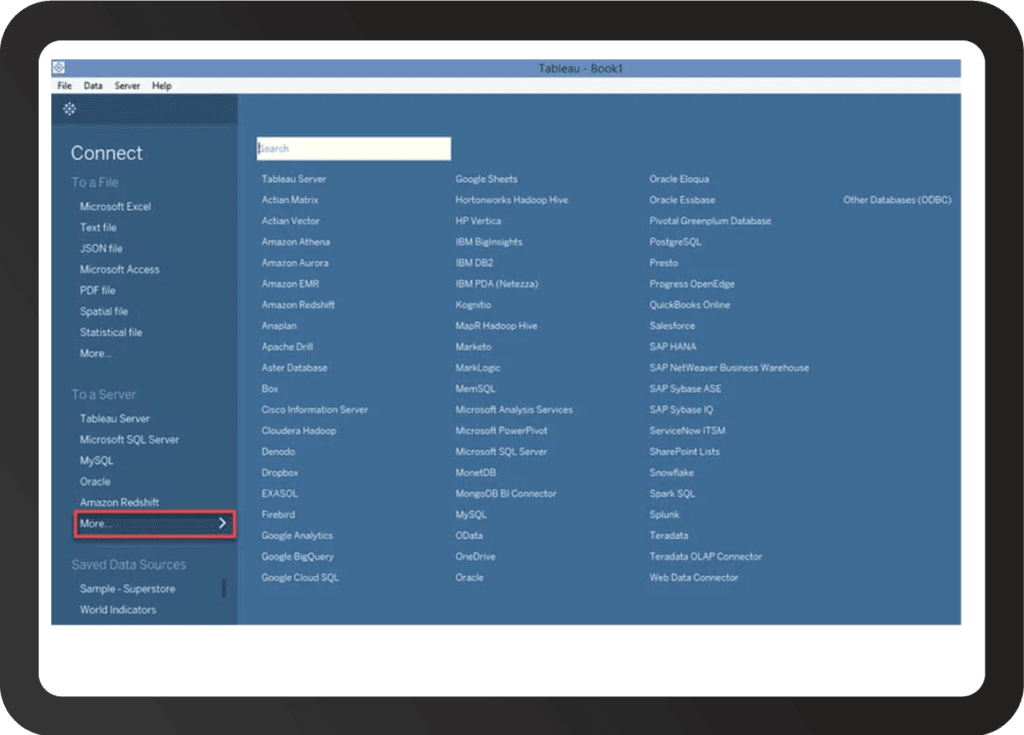
Source: Qlik Data Sources: All these tools support a wide range of data sources, including Excel, CSV, diverse databases, and cloud-based platforms. Power BI, a Microsoft product, has, as one would expect, strong integration capabilities with Microsoft’s suite of products, making it a popular choice for organizations that use Microsoft tools like SharePoint, Azure, and Dynamics 365. It also has a modeling tool to connect data sources that are individually loaded. However, if multiple sources are a primary driver for your BI implementation, Qlik has a powerful data integration engine that empowers users to combine data from multiple sources easily. Not to be left out, Tableau also has strong data integration capabilities, including native connectors to many popular data sources, and offers an easily maintainable reload scheduling system. Specifically, Tableau offers better support for Big Data platforms like Hadoop and Spark.
Data Sources: All these tools support a wide range of data sources, including Excel, CSV, diverse databases, and cloud-based platforms. Power BI, a Microsoft product, has, as one would expect, strong integration capabilities with Microsoft’s suite of products, making it a popular choice for organizations that use Microsoft tools like SharePoint, Azure, and Dynamics 365. It also has a modeling tool to connect data sources that are individually loaded.
However, if multiple sources are a primary driver for your BI implementation, Qlik has a powerful data integration engine that empowers users to combine data from multiple sources easily.
Not to be left out, Tableau also has strong data integration capabilities, including native connectors to many popular data sources, and offers an easily maintainable reload scheduling system. Specifically, Tableau offers better support for Big Data platforms like Hadoop and Spark.
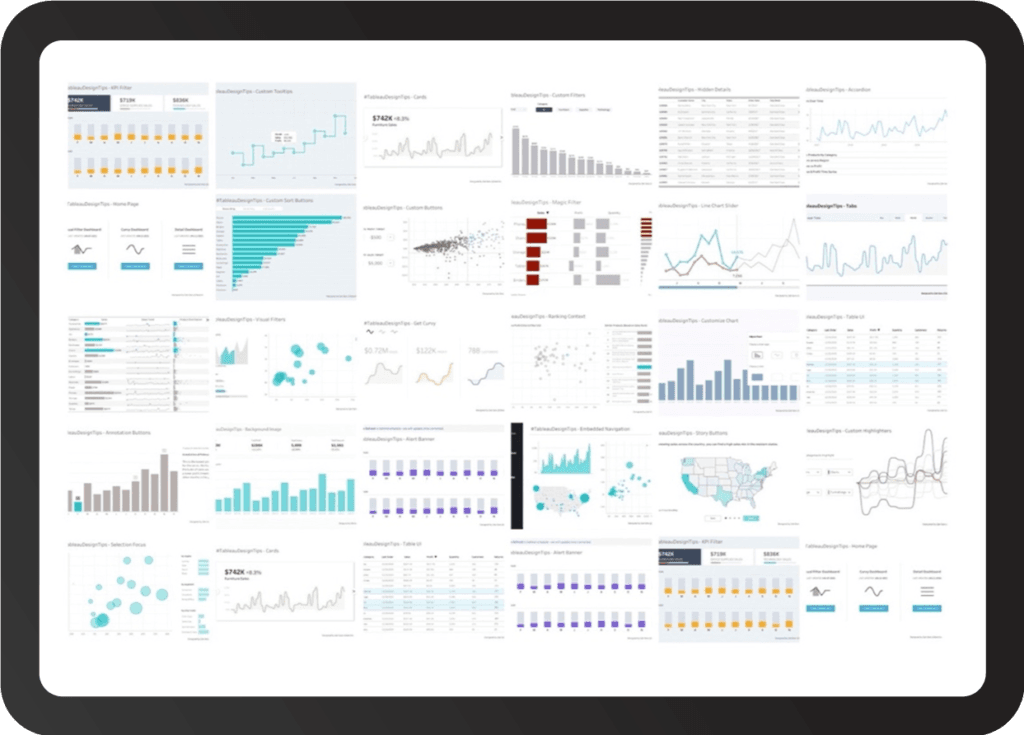
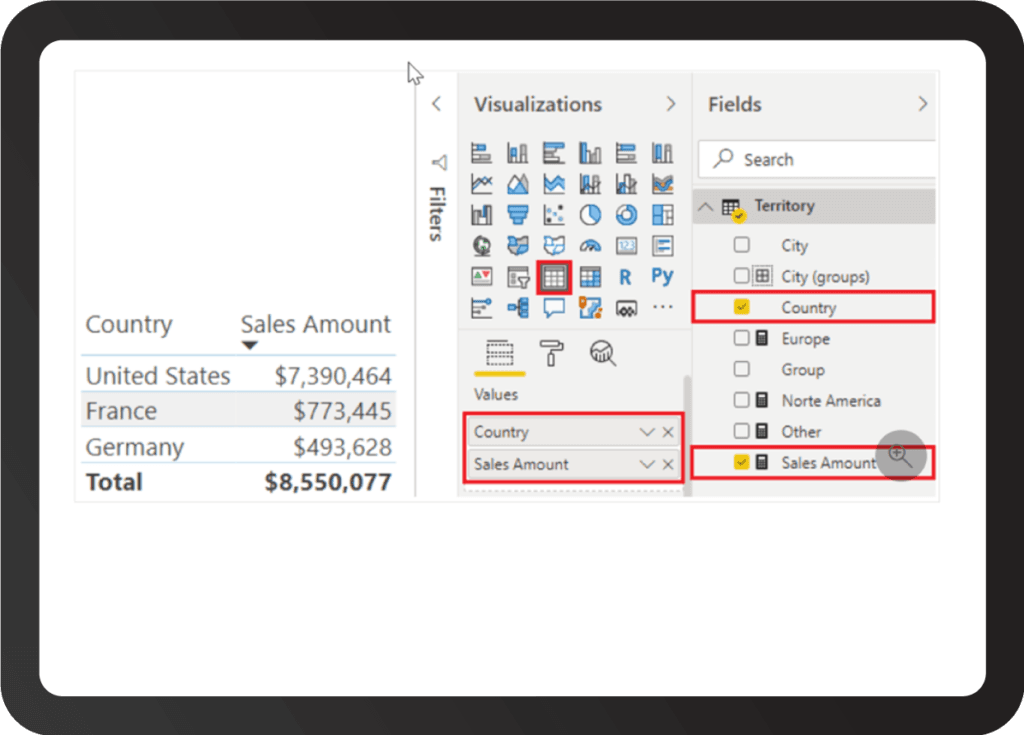
Source: Guru99.com Data Visualization: Tableau is known for its intuitive and powerful visualization capabilities, including the ability to create complex charts and graphs with ease. It offers a range of chart types and data visualization tools, and its drag-and-drop interface allows users to create complex visualizations quickly and easily.
Source: FlerlageTwins.com
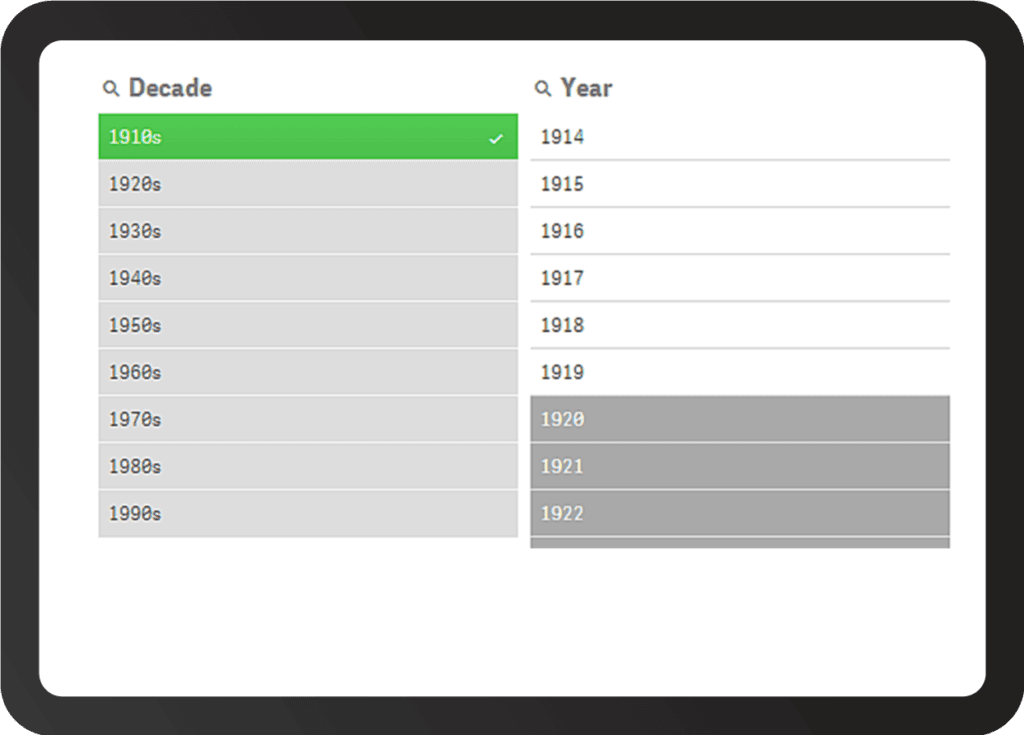
Qlik also has strong visualization capabilities, including the ability to create dynamic and interactive dashboards. Qlik offers a unique visualization style that focuses on the entire data set in a manner the other tools do not.
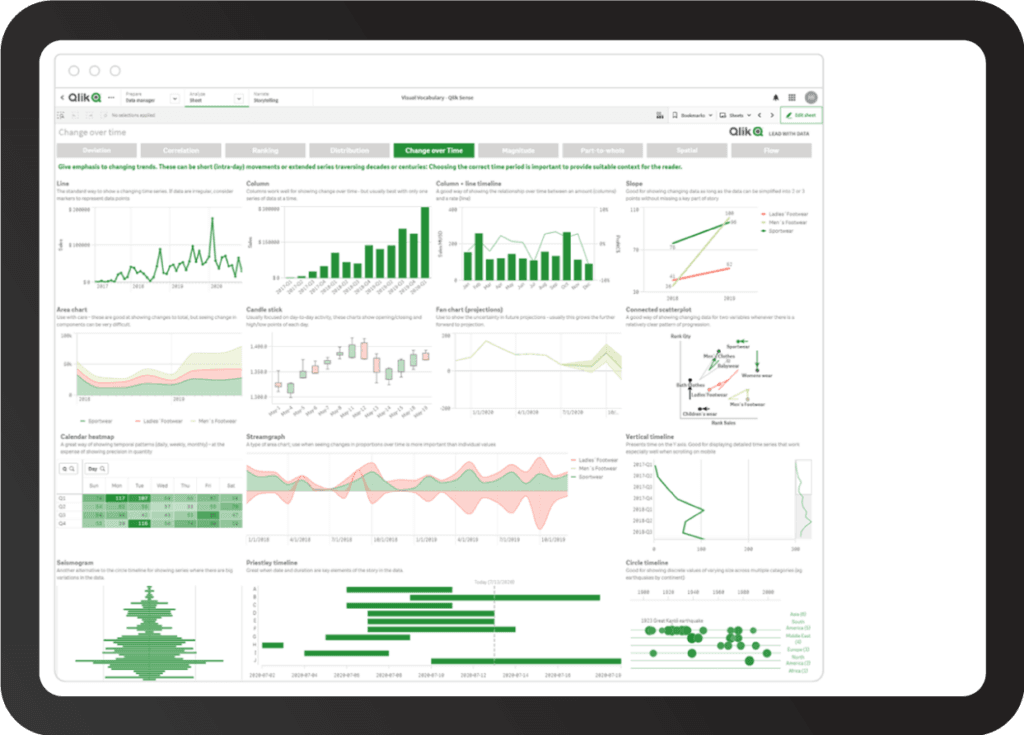
Source: Qlik
Power BI has a range of visualization options, but it is generally considered to be less powerful than Tableau or Qlik in this regard and better suited for simpler visualizations and dashboards. Power BI does offer access to Windows marketplace-type shops that provide additional options, both free and paid, that can be added in.
Data modeling: Power BI has a strong data modeling engine, allowing users to create data relationships and hierarchies easily. Tableau also offers data modeling capabilities, but they are generally considered to be less robust than those of Power BI and Qlik. Qlik offers a unique approach to data modeling, with a focus on associative data models that allow users to explore data relationships dynamically.
Data integration: Qlik is known for its powerful data integration engine, which allows users to combine data from multiple sources easily. Power BI also has strong data integration capabilities, with native connectors to many popular data sources. Tableau also offers native connectors to many popular data sources, but its data integration capabilities are generally considered to be less powerful than Qlik or Power BI.
Learning resources: Power BI has a wealth of online learning resources, including tutorials, documentation, and community forums. This makes it easy for new users to get started with the tool and learn how to use its features. Qlik and Tableau also have online learning resources, but they may not be as extensive as those available for Power BI. In terms of community engagement, Tableau has a somewhat larger presence in online forums that provide detailed help pages on topics.
Collaboration and Sharing: All these tools offer collaboration and sharing capabilities. These can be customized to easily fit into applications or sites as the user desires. Tableau offers Tableau Server and Tableau Online for sharing, Power BI offers Power BI Workspace and Power BI Report Server and Qlik offers Qlik Cloud and its Qlik Sense analytics platform.
Learning Curve: Tableau has a steeper learning curve compared to Power BI, which may make it more challenging for new users. Power BI is more intuitive and user-friendly, especially for those that are familiar with the Office 365 style of interface and formatting, making it an easier option for those new to data visualization and analysis. Qlik straddles the middle ground. It is straightforward but lacks the familiarity of a Microsoft product that is already familiar to many potential users. The most important aspect is selecting a product your employees are excited to engage with, as that will ultimately be the path to success.
Embedded Analytics: All three tools offer several options for embedding dashboards, reports, and visuals into web applications or other software. All of them have APIs that allow developers to integrate content into custom applications using various programming languages such as JavaScript, .NET, or Python.
Power BI also offers an embed code feature that allows users to embed a Power BI report or dashboard into a website or web application by simply copying and pasting an HTML snippet. To differentiate itself, Tableau offers a JavaScript API that allows developers to create custom web applications that can interact with Tableau Server or Tableau Online. Qlik’s unique embedding feature, called Qlik Sense Enterprise SaaS, allows users to embed Qlik Sense visualizations directly into web pages without requiring any programming or development work.
While all three tools provide options for embedding analytics into web applications, there are some differences in their approach and capabilities. Power BI and Tableau are more developer-oriented, with extensive APIs that allow for greater customization. Qlik, on the other hand, prioritizes ease of use, with features like Qlik Sense Enterprise SaaS that simplify the process of embedding visualizations.
Streaming Data: Similarly, each of these BI tools engage with streaming data and streaming analytics. Power BI streaming is primarily designed for simple use cases and supports a limited set of data sources, while Tableau streaming and Qlik DataStream support a more extensive range of data sources. Tableau streaming offers advanced analytics features such as predictive analytics and geospatial analysis that are not available in Power BI streaming. As for Qlik DataStream, it has a more comprehensive feature set for managing streaming data, including support for data transformation, filtering, and enrichment.
Pricing: Power BI is generally considered to be the most affordable of the three tools, with a range of pricing options that make it accessible to small and mid-sized businesses. Qlik and Tableau are traditionally more expensive. Tableau is typically the most expensive option with pricing that can be prohibitive for some organizations. However, with the release of Power BI Premium, pricing for the two tools can now be quite similar depending on the features required and depending on your Microsoft agreement. For example, in Power BI Geographic Maps are an add-on.
Conclusion
Overall, each tool has its own strengths and weaknesses, and the choice of tool will depend on the specific needs and priorities of the organization.
Power BI is a good choice for organizations that use Microsoft tools and are looking for an affordable and user-friendly option. Qlik is a good choice for organizations that need powerful data integration capabilities and the ability to create dynamic dashboards. Tableau is a good choice for organizations that need strong visualization capabilities and the ability to create complex charts and graphs.
Overall, Power BI is considered the most user-friendly of the three tools, with an intuitive interface and easy-to-learn features. Qlik and Tableau are also user-friendly, but they have a steeper learning curve and may require more training and experience to use effectively.
If you need help evaluating and/or implementing BI tools, Expeed can help. We have experts that can help you get up and running in no time.

Expeed Software is a global software company specializing in application development, data analytics, digital transformation services, and user experience solutions. As an organization, we have worked with some of the largest companies in the world, helping them build custom software products, automate processes, drive digital transformation, and become more data-driven enterprises. Our focus is on delivering products and solutions that enhance efficiency, reduce costs, and offer scalability.
AI-Powered Data Management: How Microsoft Copilot Enhances Data Governance and Analytics
June 12, 2025

Solving DateTime Issues Between Micronaut and JavaScript Using ISO 8601
June 20, 2025

Secure AI Gateways: The Smarter Alternative for Enterprises Seeking AI Control, Security, and Impact
June 24, 2025