Imagine this: you are driving through a dense forest at night, and your headlight malfunctions. How would you proceed? With zero vision ahead, it is impossible for you to drive ahead without encountering inevitable dangers. Similarly, when you start data-analytic projects with zero forecasts to guide your way, this is precisely what occurs. Achieving maximum profits with minimal resources is a challenging formula that every company strives to master, yet only a select few find success. Calculating ROI (return on investment) is essential for foreseeing your company’s future and effectively planning successful initiatives. The data analytics landscape defines ROI as the ratio of profit from data-related projects to the resources allocated to them. We need a balance in this ratio, with the former weighing more than the latter.
In this article, we are going to guide you through the metrics used to track data analytics success and how to precisely calculate the KPI to achieve the best results in data-related projects.
Metrics and KPIs to Track Data Analytics Ventures
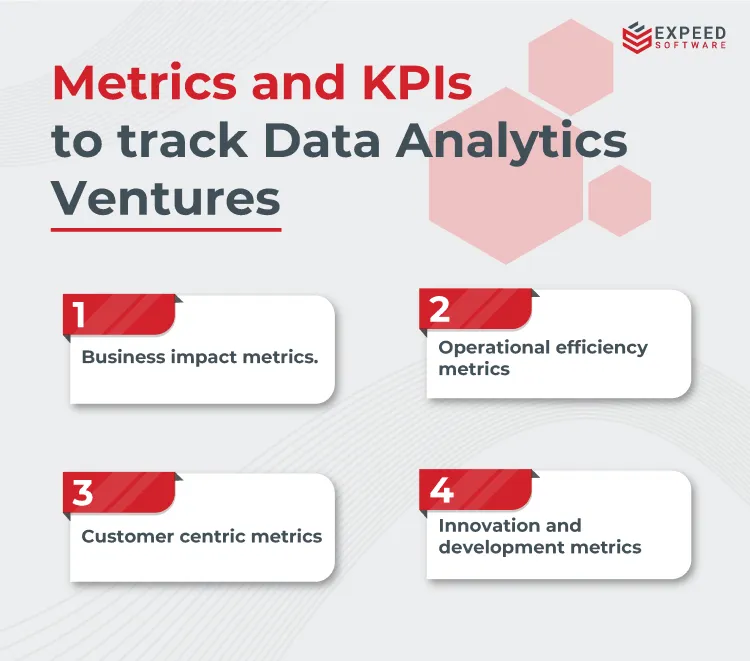
In today’s digital world, which is increasingly dependent on data-driven decisions, businesses rely heavily on data analytics teams to steer towards their objectives. Businesses should track a variety of metrics and KPIs to measure the success of their data analytics ventures. Typically, businesses compare the results to their organizational goals. The following are some key metrics to consider when assessing the effectiveness of data analytics initiatives:
Business Impact
Business impact metrics are quantifiable measures that assist organizations in assessing the degree to which their activities align with their respective objectives.
Total Revenue: To assess its business impact, an organization uses total revenue as a metric. This is determined by analyzing the overall income generated from all services and products over a specific period of time. This metric provides valuable insights into the organization’s market performance and the frequency of customer demand for its services.
Net-Profit: After calculating total revenue, the next step is to determine net-profit, a critical metric for assessing an organization’s business impact.We calculate the net profit by evaluating the total profit an organization gains after deducting all expenses, taxes, and costs.This value will help get an idea of a company’s operational efficiency and cost management.
Revenue growth rate: The revenue growth rate is a KPI that indicates the percentage increase in an organization’s revenue over a specific period of time. This KPI helps to determine the company’s growth rate.If the revenue growth rate percentage is high, it indicates the company is doing well with successful sales and marketing strategies.
Net profit margin: The net profit margin is a KPI that denotes the percentage of total revenue remaining after deducting all the expenses incurred by the company. We calculate it as (net profit/revenue) * 100. This value helps to calculate the profit a company earns per dollar of revenue. The higher the net profit margin, the better the company’s cost efficiency.
Operational Efficiency
Operational efficiency is integral for a business to thrive in the market. To achieve high customer satisfaction, the ability to provide products and services in a cost-efficient manner without affecting the quality of the deliverable is necessary.
Average project completion time: As the name implies, it is the average time taken for a project to get completed from start to finish. This metric will help the teams gain insight into the project management processes within the organization.
System downtime: Downtimes are natural for businesses that operate in the IT realm. The system downtime metric indicates the amount of time IT systems remained non-operational. This value will determine the efficiency of the systems used within the organization, as well as their reliability.
Project delivery time: This KPI indicates the percentage of projects completed on or before the deadlines. We can determine the operational efficiency of the development team by calculating this value, and if we notice any hindrance, we can take measures to improve the team’s performance.
System uptime percentage: The system uptime percentage is a KPI that helps to know the total percentage of time the systems in an organization were operational. This value will shed light on the robustness of company infrastructure and the efficiency of system management teams.
Customer-Centric Metrics
Successful businesses are not always about the producers but also about the consumers. Customer-centric metrics will give an organization a sneak peek at things from a customer’s perspective.
Customer retention rate: You can calculate the customer retention rate by analyzing the percentage of customers who consistently rely on the company’s services over a specific period of time. This value will directly reflect the amount of customer loyalty and satisfaction, exposing the organization’s efficiency among the customer pool.
Number of tickets: Most businesses function by handling customer support tickets. The total number of customer support requests handled by an organization over a specific period of time can indicate whether there are any recurring issues with the company’s operations.
Customer satisfaction score: The customer satisfaction score, or CSAT, is taken directly from a customer by asking them to rate their satisfaction with the company’s services on a scale of 1 to 5. This will let you know whether your target customers are happy with your services or whether you have to improve your functionality.
Net promoter score (NPS): You might have come across NPS multiple times when companies ask whether you will recommend their services to your personal circle. You can clearly see how likeable and satisfying your services and products are in the market by recording this on a scale of 1 to 5.
Innovation and development
Being innovative is the mantra to sustain in the industry, no matter your niche. The innovation and development metrics will give you an idea of how far along your organization is in introducing futuristic products and services while keeping customer interests in mind.
Number of features released: This metric will give you an insight into the total number of new features released by a team or the company itself as a whole over a specific period of time. This value will demonstrate your commitment to adapting to the changing digital market and introducing new features.
R&D Expenditure: Research and development is an integral part of any organization. However, it’s crucial to ensure that the expenditure aligns with the correct objectives. This metric will give an idea of the total money spent for R&D purposes within a company.
Product development cycle time: This Key Performance Indicator (KPI) measures the average duration required to complete a project starting from the initial stage of the cycle. A shorter product development cycle indicates that the development teams are efficient.
Innovation Index: The innovation index is a KPI that lets an organization know the percentage of profit made through the latest released products.
Calculating the ROI of Data Analytics Investments
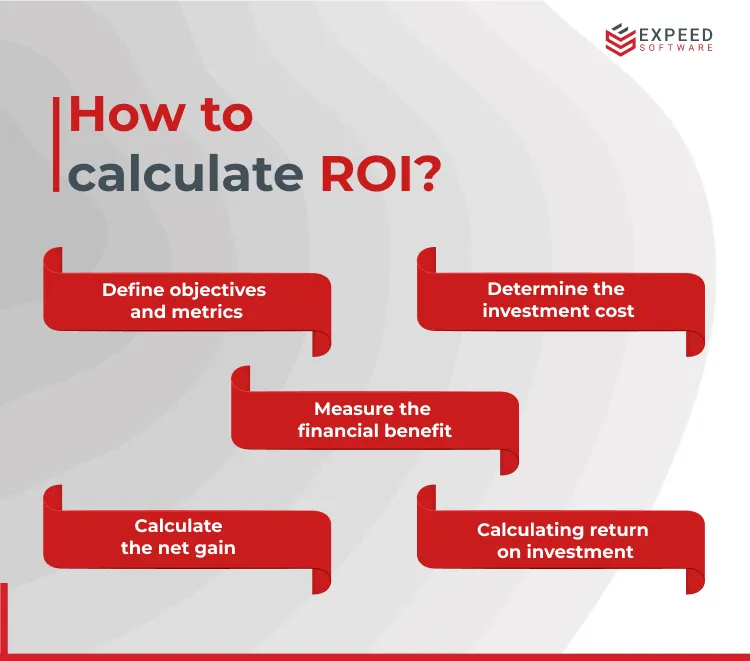
What goes around, comes around—this isn’t just a simple proverb in business. Return on investment, or ROI, is what determines how successful a business venture is. The basic idea behind calculating the ROI of data analytics initiatives is to compare the financial benefits gained by the projects to the total costs incurred. Here is a step-by-step guide to calculating the ROI of data-analytic investments.
Define Objectives and Metrics
It all starts with identifying the major objectives and goals of your data analytics investments, such as accelerating profit ratios, reducing overall costs, customer retention, etc. Once you list these objectives, establish various metrics to measure the efficiency of your data analytics investments, like sales growth.
Determine the Investment Cost
This is a vital step one must never skip: determining the costs involved in data analytics investments. This step clearly takes into account and calculates the costs related to hardware and software entities, resources, storage, consulting fees, etc.
Measure the Financial Benefits
In this step, you should take into account all the financial benefits gained through data analytics ventures and measure them promptly. It is not necessary that the financial benefits be direct. There can also be benefits, such as an increase in customer retention rates or operational efficiencies.
Calculate the Net Gain
The net gain of a data analytics investment can be calculated by reducing the total investment costs by the financial benefits calculated.
Net gain = financial benefits minus total investment costs
Calculating Return on Investment
The following formula, which depends on all the values the company has collected above, can calculate the ROI of an investment.
ROI=(Total Investment Cost/Net Gain)×100
While calculating the ROI of a data analytics investment this way, certain factors must be considered to ensure a flawless measurement of numbers. Be sure to consider costs and benefits from the same time period.
Final Word
In this highly competitive business realm, reaping maximum profit with minimal resources is a formula everyone aims to crack. Regularly calculating the return on investment (ROI) is the key to unlocking this elusive goal. Various metrics and targets serve as a compass for successfully calculating the ROI of a data analytics project. Calculating KPIs that align with organizational goals and objectives is vital for the success of data analysts. At Expeed Software, we acknowledge the importance of leveraging KPIs to drive data analytics ventures towards success. Expeed Software offers a robust suite of data analytics solutions, making us your trusted partner in harnessing the full power of data assets. Connect with Expeed to begin a journey to success, soaring through the dunes of innovation and technology!
Expeed Software is a global software company specializing in application development, data analytics, digital transformation services, and user experience solutions. As an organization, we have worked with some of the largest companies in the world, helping them build custom software products, automate processes, drive digital transformation, and become more data-driven enterprises. Our focus is on delivering products and solutions that enhance efficiency, reduce costs, and offer scalability.

Cloud vs. Code: How Cloud Software Development Acts As A Catalyst For Innovation
April 17, 2025

Coding at the Speed of Thought with AI Tools
April 29, 2025

Azure Cosmos DB: The Ultimate Database Solution for Scalability and Performance
April 30, 2025