You’ve likely come across many different business intelligence options available on the market today. But how do you choose the one platform that is right for your business?
When looking for a BI solution you should consider multiple things. For example, does it effectively deliver insights and aid in strategic decision making? Does it offer the most reliable insights rapidly and is it customizable to suit your business needs? What is the speed at which unorganized and unrelated data can be converted into reliable and actionable insights, as this is critical to businesses today, especially the ones that depend heavily on analytics processes?
In implementing solutions that give a resounding yes to those questions, we have found Microsoft’s Power BI to be an effective tool. It is one platform that allows data analytics companies and professionals to access, sort, transform and visualize information in just a matter of seconds. In the recent March 2022 Gartner® Magic Quadrant™ report, Power BI was ranked Leader for Analytics and Business Intelligence Platforms in 2022.
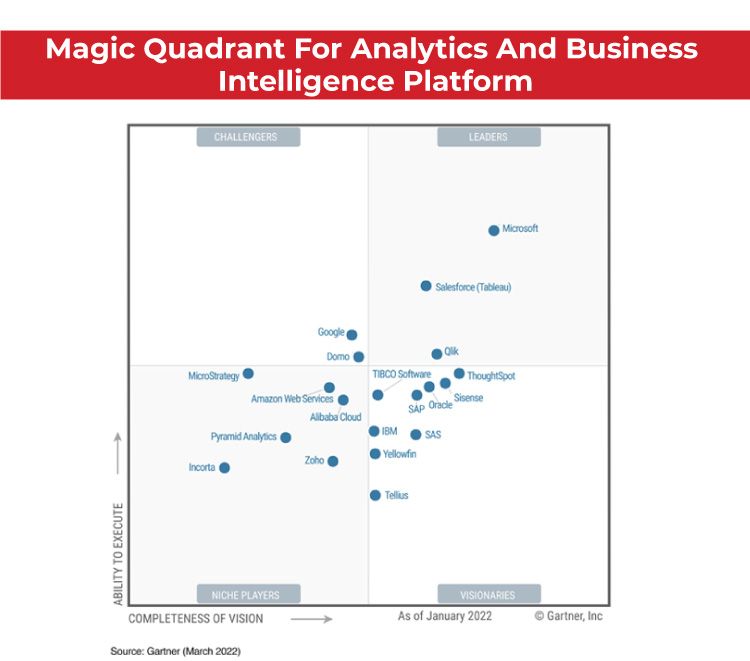
Source: Power BI
So, what makes Power BI truly powerful and how can it help your company gain a competitive edge? As a data analytics company that has been leveraging Power BI and all its functionalities for many years now, we have compiled a list of top features (according to us) that make this Microsoft tool a popular choice among data-driven companies.
Let’s find out!
What is Power BI?
The simplest way to introduce Power BI is to describe it as an interactive cloud-based reporting platform designed to help businesses find insights quickly with the help of industry-leading AI. Microsoft was already providing reporting and analytics services when it launched Power BI in 2014 with the slogan ‘5 Minutes to Wow’, focusing on the speed and AI capabilities of the tool back then. Even today, Power BI continues to be one of the fastest business intelligence clouds available in the market.
Top Reasons to Choose Power BI
Ask any business intelligence company about Power BI and they will tell you just how incredibly easy-to-use and smart it is. The platform offers a very user-friendly GUI and supports quick learning. Unlike some other BI tools. Power BI does not require its users to come from a programming background, although knowing some SQL can help.
Microsoft also offers very competitive pricing in comparison to other BI tools of similar capabilities available in the market today, especially if your company already uses the Office suite or the Azure cloud services. Power BI is available at a competitive cost as low as $10 per user.
However, none of these features can hold a candle to the tool’s core functionalities – the main reason why data analytics companies and professionals endorse Power BI. Let’s look at the top features that have helped Power BI acquire its fanbase.
Visualization Dashboards and Data Streaming
One of the great things about Power BI is that it allows anyone to visualize and analyze data with speed and efficiency, both on-premise and in-cloud. You can present your data effectively with the help of a variety of data visualization components like tables, combination charts, images, map visualizations (including shape maps and bubble maps), text boxes, shapes, and report styling options.
These visualizations, called tiles, can be pinned onto the main dashboard based on user preferences. The ease of use comes from the tool’s drag-and-drop feature which makes the entire data sorting and visualization process fast and insightful. This feature makes it easy for users, especially analysts, to share and visually express their findings with their stakeholders more effectively. The customized dashboards can be shared securely across the organization and pave the way for effective collaboration.
Power BI also lets you display real-time data on your dashboard. By connecting to IoT sensors, factory devices, social media, or any other device that offers time-sensitive data, the platform can transmit real-time visual insights to your dashboard, helping you take time-critical business decisions.
Integrated Predictive Analytics and Machine Learning (AI)
Power BI allows users to create predictive models with the help of the Azure Machine Learning Studio. By dragging, dropping, and connecting data modules, even data analysts from non-developer backgrounds can easily create predictive models that support the organization’s strategic decision-making processes.
The integration of programmatic platforms like R and Python makes Power BI’s advanced analytics functions all the more powerful and effective. The tool pulls data from Azure SQL, sends it to Azure Machine Learning web service, compiles the results, and then reads the scored data into the main analytics engine. As an example, using the R connector, users can run R scripts directly in Power BI and import the results into a Power BI data model.
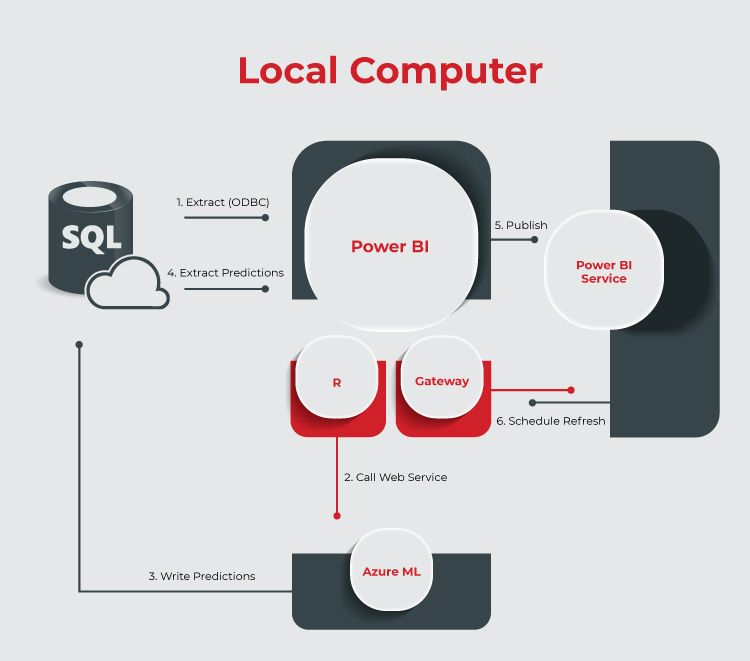
Information Source: Arbela Tech
The AI capabilities of Power BI that support all its core functionalities can be classified into two categories:
- AI Visuals – including Smart Narrative, Python-visual, Clustering, R-visual Forecasting, Anomaly Detection, Q&A, Decomposition Tree, Key Influencers, Quick Insights.
- AI Enrichments – including Cognitive Services, AutoML, AzureML, R/Python transforms.
oday, with the AutoML integration in Power BI, a user can build and train a custom ML model and apply it to get predictions while loading data into a data flow.
In most BI tools, analytics insights are often presented in an unintelligible format, due to a lack of integration between the analytics engine and visualization tools. Here, Power BI offers seamless integration with visualization modules at the analytics engine level, making it possible for users to visually comprehend the data forecasts and draw quick business insights. For example, with the AutoML integration in Power BI, a user can build and train a custom ML model and apply it to get predictions while loading data into a data flow
Secure Data Environment
Another great reason to choose Power BI is the secure data environment that it offers. Built on the Amazon cloud services platform, Azure, the Power BI service architecture is based on two clusters – the Web Front End (WFE) cluster and the Back-End cluster. The platform uses Azure Active Directory (Azure AD) to authenticate clients and provide tokens for client connections to the back-end cluster which houses all the important functionalities needed to support Power BI’s primary features.
Each back-end cluster hosts data of all the tenants assigned to that particular cluster. It has robust encryption for both data at rest and data in transit. Data at rest is encrypted in Azure BIob Storage and Azure SQL DB while data in transit is encrypted with HTTPs. All data in use is cached, encrypted, and stored in the Azure SQL database.
As a business, subscribing to even a basic Power BI user package offers more reliable data security than many tools in the BI landscape. However, the security features improve greatly if you go for a premium subscription. Microsoft offers improved isolation, resource allocation, supportability, security isolation, and scalability for its premium subscribers. Options for implementing SSO and enhancing data encryption are also available.
Variety of Data Sources
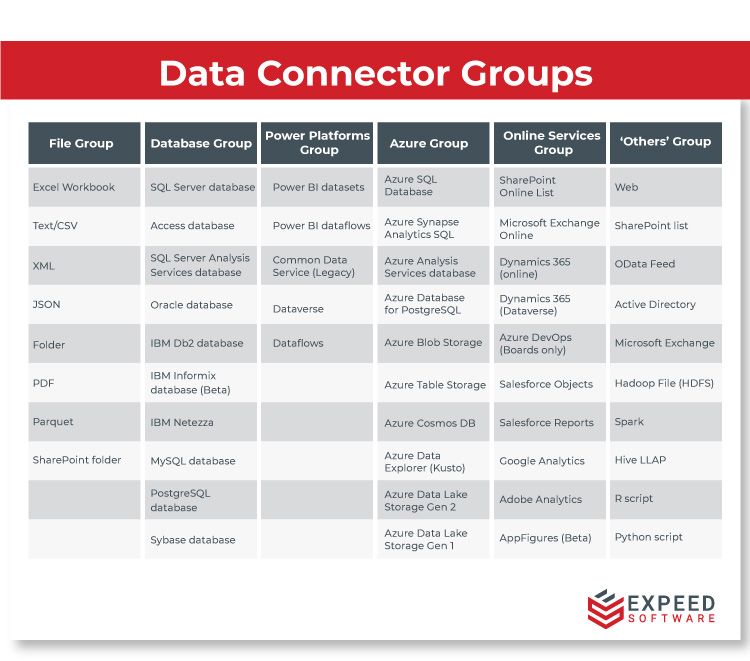
Power BI supports a large range of data sources. Over 200 types of data sources can be connected to Power BI. With the help of its many built-in connectors, users can load different types of data sets from various sources, link them together and build consolidated reports and charts. Based on data types, the built-in connectors are divided into four groups – the file group, database group, Power Platforms group, Azure group, online services group, and the ‘others’ group.
With so many data import options, Power BI makes it easier for a business intelligence company to compile and convert all data, lying distributed across multiple sources like Excel, SQL DB, Facebook, Google analytics, etc. With real-time data streaming, keeping track of all new data sets becomes even more effortless. The data streaming feature also opens possibilities of setting up anomaly detection processes that can help businesses mitigate risks and improve ROIs.
Power Query is the technology used by Power BI to get data from a wide variety of data sources. Once the data is loaded, the platform’s powerful ETL functionality allows users to edit, clean, and transform the data into arrays and data sets necessary to build a visualization.
What the Future Holds for Power BI?
Microsoft has already announced its plans for bringing in improvements like better diagnostic information, log analytics, usage information capture through audit logs, etc. Add to this some features like export to Excel functionality (with options to maintain the format), integration with PowerPoint, and role-level view of artifacts, and we are looking at a truly Power-ful BI, in every sense of the word.
Integrating Power BI with Expeed Software
At Expeed Software, we have been leveraging the full potential of Microsoft Power BI for many years now. As the business environment becomes more data-reliant, we help our clients make better decisions with the support of advanced analytics and AI tools like Power BI. Businesses are always on the lookout for actionable insights drawn from their transactional data to tide over the competition. As a data analytics company specializing in driving BI transformations, we can help set up data-driven processes for your organization that leads to better decision-making and growth.

Expeed Software is a global software company specializing in application development, data analytics, digital transformation services, and user experience solutions. As an organization, we have worked with some of the largest companies in the world, helping them build custom software products, automate processes, drive digital transformation, and become more data-driven enterprises. Our focus is on delivering products and solutions that enhance efficiency, reduce costs, and offer scalability.

AI-Powered Data Management: How Microsoft Copilot Enhances Data Governance and Analytics
June 12, 2025

Solving DateTime Issues Between Micronaut and JavaScript Using ISO 8601
June 20, 2025

Secure AI Gateways: The Smarter Alternative for Enterprises Seeking AI Control, Security, and Impact
June 24, 2025