A frequent term you are likely to encounter when looking at data analysis is “distribution”. The distribution of data is simply how the data are arranged. Often people will look for a mathematic formula to describe this distribution, but you can learn a lot about your data even with a visual inspection of the distribution. Understanding the distribution is also very important if you want to know if certain tools or models make sense to use on a given dataset.
To visualize the distribution of your data, plot them as a histogram. This can be done in a normalized manner or using actual value counts. The more data you have, the easier it is to see the patterns and the more likely it is that the data represent the real population you are dealing with.
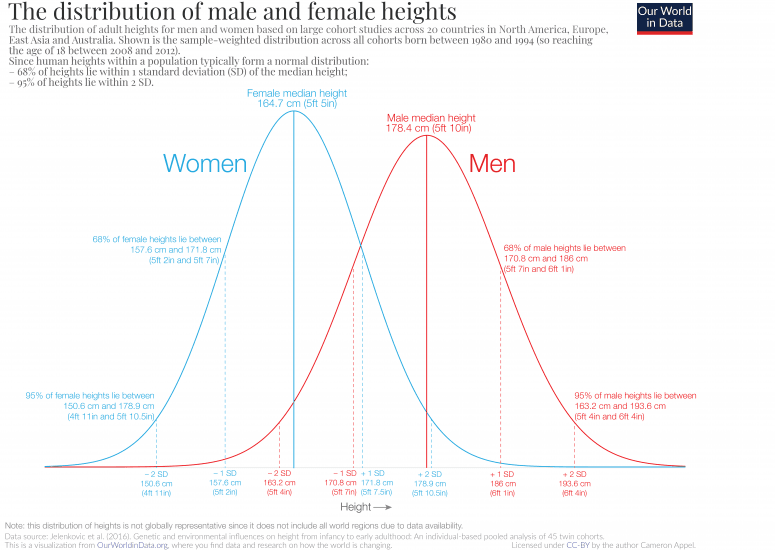
For example, you can take populations of adults and look at their heights. Some people are taller while others are shorter. While the average height may not describe any specific person it is a good estimate of what you might expect from a group of random people pulled from the population you looked at. Similarly, if you group by another attribute, such as gender, you can see how the resulting groups compare. As, shown by the figure from “Our World in Data” the number of men or women, higher and lower than their respective average is roughly equal; a key feature of a Normal, or Gaussian, distribution.
Unlike human heights, a symmetric shape is clearly missing from the distribution of mountain heights (https://en.wikipedia.org/wiki/List_of_mountains_by_elevation), for instance.
This is also a good example of how a dataset is dependent on the decisions of the person that compiled it. Particularly, one may ask how did the author decide on which mountains to include? For example, there are likely places near you taller than Tianzhong Mountain at 12 feet in elevation, so what makes it a mountain and the hill you sled on not a mountain?
Both of these are examples of continuous distributions. Any number can be valid, within the applicable range; mountains and people by definition can’t have a negative height. But we can also look at discrete distributions where only certain numbers are allowed. For example, if we look at the number of people it takes to screw in a lightbulb, according to one selection of lightbulb jokes on the internet, you only get answers that count whole people. Because of this, you need to approach the data differently.
In conclusion, it’s important to look at your dataset and determine if the tools and models you’re using to analyze it are appropriate to accomplish your goals.

Expeed Software is a global software company specializing in application development, data analytics, digital transformation services, and user experience solutions. As an organization, we have worked with some of the largest companies in the world, helping them build custom software products, automate processes, drive digital transformation, and become more data-driven enterprises. Our focus is on delivering products and solutions that enhance efficiency, reduce costs, and offer scalability.

AI-Powered Data Management: How Microsoft Copilot Enhances Data Governance and Analytics
June 12, 2025

Solving DateTime Issues Between Micronaut and JavaScript Using ISO 8601
June 20, 2025

Secure AI Gateways: The Smarter Alternative for Enterprises Seeking AI Control, Security, and Impact
June 24, 2025